
A Placemaking Journal
Public Participation Surveys: Strengths, Pitfalls, and Tweaks

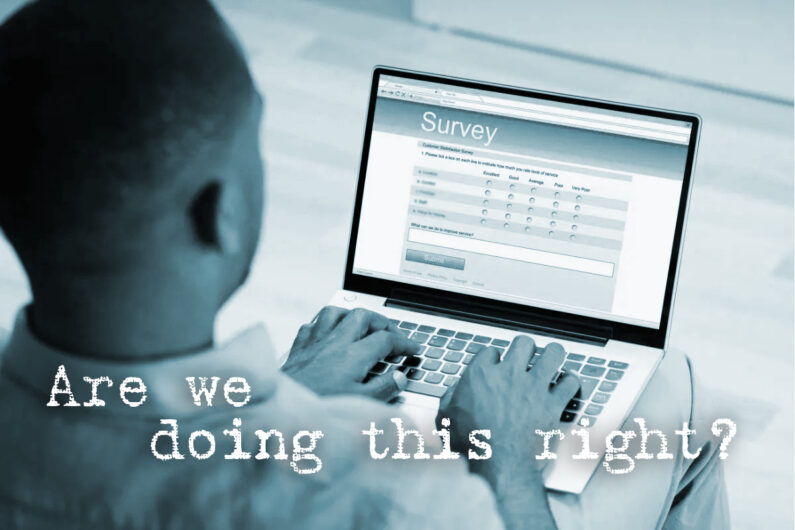
Surveys are everywhere these days. Every time you turn around, someone wants you to rate your meal, or your doctor visit, or your hotel stay. And public participation is no different. Widespread internet access and digital survey tools have made conducting surveys for public participation much easier and cheaper than they were when we had to print and mail surveys or survey people in person. In my first 10 years as a planner, I was only involved in three surveys (one mail, one telephone, and one in person intercept survey). But now almost every project has at least one or more surveys.
So do all these surveys make public participation better? And are we doing them the right way?
The way planners conduct surveys for public participation is very different than the way statisticians conduct surveys for research. A core principle of survey research design is that the sample of survey participants must be random. The only way that sample survey results can be extrapolated to the whole population is if everyone in the population has an equal chance of being in the sample. But in my entire 25+ year career as a planner, I have only been involved in two random sample surveys. All of the other surveys connected with any project I worked on have had what researchers call a convenience sample. This is when you broadcast the availability of the survey and take answers from anyone who responds. Almost all surveys for public participation purposes use this recruitment and sampling method.
So what’s wrong with using convenience samples? People who volunteer to answer surveys are fundamentally different than people who do not. For one thing, people who hear about the survey opportunity are going to be different than the people who didn’t hear about it – they have different communication networks. Also, certain groups are more likely to respond. For example, web-savvy people with good internet access are more likely to respond to web surveys, leading to a sample that differs from the overall population in web skills, altruism, and other measures such as income and education.
On top of that, the smaller the population, the more variability there is in responses. Topics related to small population shares are more variable and suffer more from selection bias. So if you’re asking about issues related to playgrounds, or bike travel, or taking transit, but only a small share of the population uses those things, the results on those questions will be even more skewed with a convenience sample. And lots of the things we ask about as planners are of interest to just a small slice of the population.
Researchers would — in all honesty — be appalled at the way we go about this.
This brings us to the question of what does a survey do in a public participation process? If it’s not collecting reliable information that can be extrapolated to the population, what is it for?
The best way to think about surveys in public participation processes is that they extend our reach. They allow us to reach more people (and often a more diverse set of people) than we can through more intensive engagement tools, such as public meetings. They give people a way to participate that is quick and easy, making public participation much more accessible. There are lots of barriers to people attending planning meetings, and we know that the people who attend planning meetings differ from the overall population in important ways (they tend to be older than median age, have higher income, have higher levels of education, and are more likely to be white and more likely to be homeowners rather than renters). So making participation more accessible by giving people a way to participate that is easier and less time consuming than attending a meeting probably moves our processes towards better representation of the overall population, which is a good thing.
The problem is that survey results are expressed in specific numbers, which most people interpret as hard information. The most common exposure people have to survey results are things like Gallup polls or polls about election outcomes, which are random sample surveys whose results can legitimately be extrapolated to the whole population. People have been conditioned to think of survey results as applying to everyone. But public participation surveys in planning are fundamentally different than that. The results of convenience sample surveys tell us nothing about the population as a whole. They only give us information about the people who answered the survey.
So what’s to be done? Online surveys are here to stay, and they do have some positive impact on public participation (broadening who we hear from). But planners can borrow methods from research design to tweak the way we recruit participants and analyze and report results to increase the benefit from our public participation surveys and minimize the weaknesses.
Recruitment & Survey Design
In conducting public participation surveys, planners should work to nudge our convenience samples more in the direction of random samples. We must use a wide variety of communication channels to reach a diverse pool of potential participants. We should think about how a specific channel may bias the recruitment results and try to counterbalance that channel with a different channel that may bias in the opposite direction. When the representativeness of input is important, we can use quota sampling based on demographics or introduce other attempts at randomization. For instance, instead of distributing surveys to every house in the neighborhood, we can survey each block until we collect a certain number of surveys and then move on to the next block, so that each block is equally represented in the neighborhood survey. If the representativeness of the data is crucial, we should use a survey organization to conduct a random sample survey.
Finally, we must design our surveys so that the questions are easy to understand, the interface is easy to use, and the survey is not too long so that we don’t bias the results by encouraging people to give up partway through. Best practice is to pilot test the survey by having a few actual community members (not planners or city staff) complete the draft survey and give you feedback about anything that was unclear or confusing.
Analysis
As we analyze survey results, we can introduce measures to understand or counterbalance any bias in our data. At the very least, we should always compare some measures in our non-probability results to known data about the whole population to assess how well the sample approximates the population. Planners often report percentages on key measures (such as gender or race or mode of travel) and may place those percentages next to a similar chart for the neighborhood or city. But we can also use statistical tests (such as a z test) to see if any differences we see in the distributions are significant or not. If it’s really important to use the survey results to estimate what the population thinks, and you can’t conduct a random sample survey, it’s possible to weight the results of some measures based on demographic factors. But this can be tricky, so for that, it’s best to get a statistician involved.
Reporting
We can also change how we report our convenience sample survey results to reduce the chances that people will misinterpret what they mean. At the very least, we should explain the limitations of our sampling method and caution that the results are only valid for the people who took the survey—that just like the input at a public meeting, the input from a convenience sample survey cannot be extrapolated to the whole population.
People tend to give more weight to numbers that are expressed with more precision. So stating that 74.23% of people prefer option 1 sounds more definitive than saying about 74% of people prefer option 1. But we know from the limitations of sampling that our results just aren’t that precise. With these kinds of surveys, it’s more honest to express results in very round numbers or order of magnitude rankings, not more precise numbers.
Answering a short survey is a lot easier and more accessible than attending a public meeting. Using online surveys as part of our participation toolbox is one way to broaden our reach and include people who can’t or don’t otherwise participate. But as planners we should recognize the strengths and weaknesses of this tool and use it appropriately.
With great power comes great responsibility!
